2016 U.S. Elections Statistics
Abstract
Group project concerning the 2016 American presidential elections. This research aims to obtain some insight into the pre-election polls and to what extend they truthfully and accurately reflect the election results. In particular, we focus on the 2016 presidential elections due to the particular circumstance in which the pre-election polls seem to have given an inaccurate representation of the popular choice. In this paper we take a journey through mathematical and statistical approaches to random sampling, polling, hypothesis testing and simulations of poll results, and we attempt at providing a potential answer to why we observed such contrasting results.
Quick Look
The best way to assess public opinion in the least biased way possible is to perform what is called random sampling in statistics. It is defined by three core concepts: independence, confidence interval, and hypothesis testing.
Independence is important to ensure that one person's opinions will not influence another's.
Confidence intervals are numerical estimates of distribution parameters, such as the mean or the variance. They represent the probability that an interval (with a certain margin of error) contains the true parameter estimate if the sampling process is repeated a lot of times.
Hypothesis testing helps us determine whether the given evidence is statistically significant enough.
In this project we consider the ideal scenario where a person's opinion can be described by a Bernoulli variable Xi~Bernoulli(0.5). Then, we can estimate an ideal sample size with significance α = 0.05 and a margin of error ε = ±3%:
In fact we have varying sample sizes depending on the desired confidence interval size:
| Sample Sizes with p = 0.5 | |||||
|---|---|---|---|---|---|
| ±1% | ±2% | ±3% | ±4% | ±5% | |
| 80% | 4105 | 1026 | 456 | 256 | 164 |
| 90% | 6763 | 1690 | 751 | 422 | 270 |
| 95% | 9603 | 2400 | 1067 | 600 | 384 |
| 97% | 11773 | 2943 | 1308 | 735 | 470 |
| 98% | 13529 | 3382 | 1503 | 845 | 541 |
| 99% | 16587 | 4146 | 1843 | 1036 | 663 |
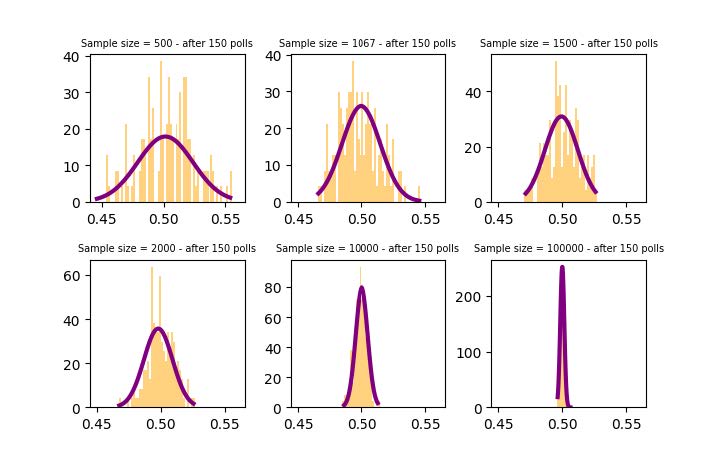
As the sample size increases, we notice that the distribution of the sample means (pg. 9) tends to a Gaussian distribution and the variance tends to 0.

This behaviour is described by the central limit theorem and it's the expected result given that the confidence interval is defined as
so as the sample size increases (n → +∞) the margin of error decreases, which in turn implies that eventually the true mean will coincide with the estimate.
The project further delves into error analysis (type I and II errors), the power of the hypothesis, and a brief discussion on forecasting.
